Buyer Utility Map Audit for Hardware (Worksheet)
⏱ 27 min read
What the 36-Box Hardware Buyer Utility Audit Reveals
The Buyer Utility Map audit is a diagnostic matrix that evaluates physical hardware across 6 buyer experience stages—Purchase, Delivery, Use, Supplements, Maintenance, and Disposal—against 6 utility levers: Productivity, Simplicity, Convenience, Risk Reduction, Fun/Image, and Environmental Friendliness. It uncovers severe friction points that engineering teams routinely overlook by obsessing exclusively over runtime feature performance. By charting your product across these 36 distinct intersections, the audit isolates exactly where hidden customer frustrations kill adoption. This immediately raises the question: why do technically superior hardware products routinely fail in the market despite flawless spec sheets?
Physical products carry physical consequences that software teams never encounter. If a software startup ships code with an awkward onboarding flow, product managers deploy an over-the-air patch in 48 hours. When a hardware company ships a connected device that requires proprietary mounting brackets or takes 45 minutes to unbox, you cannot fix that failure with an over-the-air update.
A utility block is any friction point within the buyer journey that forces a customer to expend unplanned time, effort, or money to extract value from a product. In the framework introduced by W. Chan Kim and Renée Mauborgne in Harvard Business Review, these blocks occur across lifecycle stages that engineers rarely track.
Hardware engineering teams focus heavily on the "Use" stage combined with the "Productivity" lever. They spend 18 months optimizing component efficiency, sensor precision, and battery life. Meanwhile, buyers reject the product during the "Supplements" stage because replacement cartridges take 3 weeks to arrive, or during "Maintenance" because servicing requires specialized hex keys.
🕰️ How It Really Happened: Juicero’s $120 Million Utility Blind Spot
In 2017, hardware startup Juicero shut down after raising $118.5 million from investors including Alphabet’s GV and Kleiner Perkins. Founder Doug Evans spent three years engineering a custom cold-press juicer containing custom aluminum press arms, an optical scanner, and a motor capable of generating 4,000 pounds of force. In April 2017, Bloomberg reporters Ellen Huet and Olivia Zaleski published video evidence showing that users could squeeze the company’s proprietary produce packs by hand faster than the $399 machine could press them, yielding 7.5 ounces of juice in 90 seconds. Hardware investor Ben Einstein published a teardown on Bolt VC’s blog documenting that the press contained over 400 custom mechanical components, including 10 custom injection-molded parts and precision gearboxes. The engineering team optimized the Use/Productivity box with extreme mechanical precision, but completely ignored the Simplicity lever during Use and Purchase. Customers realized the machine added zero utility over manual effort.
Source: Ellen Huet and Olivia Zaleski, Bloomberg News (April 19, 2017); Ben Einstein, Bolt VC teardown (April 20, 2017)
The capital risk peaks when manufacturing commitments lock your design. Discovering a utility block before tooling costs almost nothing to fix in CAD software. Discovering that same block after cutting hardened steel injection molds leads directly to expensive retooling delays.
According to product development data published by Boothroyd Dewhurst, design decisions set roughly 70% of a physical product’s final manufacturing cost within the early concept phase. Modifying a multi-cavity injection mold to fix an awkward assembly latch costs anywhere from $25,000 to over $120,000, while adding 8 to 14 weeks of tooling lead time. If you misjudge how users install or power a device, your unit economics collapse under warranty returns and field service calls.
To spot these hazards before committing tooling capital, run your prototype through the Buyer Utility Map: 36-Question Diagnostic (Self-Test). Pairing this diagnostic with your Hardware BOM Cost Model: Unit Economics (With Template) ensures you do not invest thousands of dollars optimizing features that fail to move customer adoption. If you find multiple blocks across installation or servicing, use the 8-Step Hardware Job Map Canvas (With Template) to trace the user’s operational path, or establish clear 7 R&D Kill-Switch Criteria to Cut Losses (Worksheet) before opening purchase orders for long-lead production tooling.
The diagnostic process begins by breaking down the 6 lifecycle stages to isolate where your current product architecture quietly traps user progress.
Key Takeaways
- The 36-box grid maps 6 buyer experience stages against 6 distinct utility levers.
- Hardware teams over-index on ‘Customer Productivity’ during use while ignoring delivery and disposal.
- Targeting unaddressed blocks cuts hidden post-purchase friction and warranty returns by double digits.
- A structured 60-minute audit exposes non-feature differentiators competitors cannot easily copy.
Table of Contents
- What the 36-Box Hardware Buyer Utility Audit Reveals
- The Six Stages of the Hardware Experience Cycle
- The Six Utility Levers Applied to Physical Devices
- Diagnosing Common Utility Traps in Hardware Roadmaps
- Four-Step Procedure to Run the Audit with Engineering and Product
- The Complete 36-Box Hardware Audit Worksheet
- Sources & Further Reading
The Six Stages of the Hardware Experience Cycle
The hardware experience cycle tracks every physical and digital interaction a customer has with a device across six sequential operational phases: Purchase, Delivery, Use, Supplements, Maintenance, and Disposal. In Kim and Mauborgne’s Blue Ocean Strategy, mapping these six stages exposes hidden operational friction that engineering roadmaps routinely miss. When you apply this cycle to physical devices, you must audit how parts, mass, energy, and software create drag on the end-user.
Stage 1: Purchase
Hardware friction begins months before a transaction clears. Buyers need unambiguous physical specifications to know whether a product fits their operational envelope. If an industrial scanner or commercial kitchen mixer lacks clear volumetric envelopes on the spec sheet, procurement stalls.
Packaging footprint dictates shelf space and logistics math. Volumetric weight is a pricing calculation used by commercial freight carriers that converts the physical dimensions of a package into an equivalent estimated weight based on cubic volume. If your packaging adds 30% dead volume in uncompressed air and foam, wholesale distributors penalize your margin immediately. Packaging must balance retail theft resistance with unpacking friction. A customer wrestling with heat-sealed clamshell plastic starts ownership with frustration before the device even turns on.
Stage 2: Delivery
Delivery tests whether the product survives transit and runs without field assistance. Logistics weight governs air and ground freight tariffs. Packaging engineer Walter Soroka notes in the Fundamentals of Packaging Technology that drops from just 48 inches generate impact shocks exceeding 40 Gs on internal solder joints.
Unboxing ergonomics must guide hands naturally to lifting points. For units over 15 kg, you must mark dual-person lift points on the cardboard exterior to meet OSHA lifting guidelines. Calibration time is your next hurdle. If a device requires 45 minutes of manual sensor calibration out of the box, return rates jump. Ship devices with at least 40% initial battery charge. An uncharged battery forces the buyer to halt onboarding immediately to plug into a wall, destroying the initial setup momentum. Aligning these early milestones with your 8-Step Hardware Job Map Canvas (With Template) prevents costly engineering redesigns later.
Stage 3: Use
Daily operation reveals whether the core functional interface is intuitive. Tactile buttons, rotary encoders, and status LEDs must communicate device health within 200 milliseconds.
Power draw impacts total cost of ownership. The International Energy Agency found in its standby power survey that idle power consumption accounts for roughly 8% of residential electrical bills. Keep passive standby power draw under 0.5 watts to comply with European Union Ecodesign directives. Operating noise must stay below 45 dBA in office settings to avoid cognitive fatigue. Physical ergonomics must fit the 5th to 95th percentile user reach profiles, preventing strain injuries during high-frequency tasks. Check your bills of materials early against a Hardware BOM Cost Model: Unit Economics (With Template) so premium ergonomic grips do not compromise production margins.
Stage 4: Supplements
Hardware rarely functions in isolation. It relies on cables, mounts, secondary apps, and proprietary consumables.
Cable standard mismatches create immediate operational friction. If your controller uses legacy micro-USB while the industry has standardized on USB Type-C, users misplace or break chargers. Mounting brackets must match standard patterns like VESA 75 or DIN rails. Avoid proprietary bolt spacing that forces customers to machine custom plates. If your hardware requires an accompanying iOS or Android app to function, account for operating system deprecation schedules. When an app update breaks Bluetooth Low Energy pairing, the physical hardware becomes an expensive brick. Track recurring consumable reorders; running out of specialized filters or paper rolls stops workflow completely.
Stage 5: Maintenance
Maintenance determines whether a product lasts three years or thirty months. Clean access points must not require specialized security Torx screwdrivers when a user needs to clear dust from a cooling fan.
Firmware flashing stability requires hardware-level failsafes. Dual-bank flash memory preserves the previous working operating system if a remote update fails mid-transfer. Modular wear-and-tear replacement gives technicians access to high-friction components like rubber belts, drive gears, and silicone gaskets without disassembling structural chassis members. Provide clear diagnostic codes directly on screen or via blink codes on an LED status line. When field operators can pinpoint error "E-04" as an intake blockage, support call durations drop from 25 minutes down to three. Prioritizing these field-service features during planning prevents costly post-launch patches, as detailed in our guide on B2B Feature Prioritization: 4 Steps (With Worksheet).
Stage 6: Disposal
Disposal design is now governed by strict global mandates. The European Union’s Waste from Electrical and Electronic Equipment (WEEE) Directive requires manufacturers to finance recycling infrastructure and reach specific material recovery quotas.
Battery removal compliance is critical. Glued-in lithium-ion pouches present severe thermal runaway fires inside commercial shredders. Fasten battery packs with pull-tab adhesives or accessible mechanical fasteners so dismantling takes under 60 seconds. Use single-polymer plastics stamped with ISO 1043 resin identification codes to improve sorting efficiency. Minimize material separation friction by avoiding glued metal-to-plastic laminates. When end-of-life arrives, clear trade-in programs lower disposal friction and recover raw materials. For products approaching their phase-out horizon, use our Legacy Product Sunset Matrix (Scoring Worksheet) to manage end-of-support timelines without stranding legacy parts.
The diagnostic process works best when hardware teams evaluate their prototypes against these real operating constraints. Run through the Buyer Utility Map: 36-Question Diagnostic (Self-Test) to audit your own system across these exact touchpoints.
Pick your situation
Field returns spike during the first 14 days
Use this review when warranty and RMA return rates exceed 5% within two weeks of customer receipt. Open the cross-functional meeting by reviewing unboxing footage directly with mechanical engineering and packaging leads.
14-DAY OUT-OF-BOX DEFECT AUDIT
===============================
Target Metric: Reduce first-14-day RMA rate from [CURRENT_RMA]% to [TARGET_RMA]%
Date: [DATE]
Auditor: [NAME/TITLE]

1. OUT-OF-BOX BATTERY TEST
- Pack charge on arrival: [MEASURED_%] (Standard: >= 40%)
- Time to initial operational boot: [MEASURED_MINUTES] (Standard: < 2 min)
- Pass/Fail: [PASS/FAIL]

2. UNBOXING FRICTION LOG
- Number of tools required to open package: [TOOL_COUNT] (Standard: 0)
- Presence of pull-tabs on internal trays: [YES/NO]
- Documentation readability: Time to step 1 completion: [MINUTES]

3. FIRST-RUN CALIBRATION & SETUP
- Sensor zeroing time: [MINUTES] (Target: < 3 min)
- App pairing failure rate over 20 trials: [FAILED_COUNT]/20
- Root cause for pairing aborts: [BLE_TIMEOUT / FIRMWARE_MISMATCH / UX_DROP]

CORRECTIVE ACTIONS:
- Action 1: [PACKAGING_CHANGE] | Owner: [ENGINEER] | Due: [DATE]
- Action 2: [FIRMWARE_RELOAD]  | Owner: [ENGINEER] | Due: [DATE]
Hardware fails basic field serviceability benchmarks
Run this diagnostic when service contract costs rise or mean time to repair exceeds targets. Open by timing a junior field tech replacing the highest-wear component.
MODULAR FIELD SERVICEABILITY AUDIT
==================================
Subsystem Under Test: [SUBSYSTEM_NAME]
Bench Technician: [NAME]
Target MTTR: [TARGET_MINUTES] minutes

1. DISASSEMBLY ENVELOPE
- Total fasteners to reach wear part: [SCREW_COUNT]
- Tool variety required: [LIST_TOOLS] (Target: Single bit, e.g., T10 only)
- Structural parts disturbed during service: [LIST_PARTS]
- Disassembly time elapsed: [MINUTES] min [SECONDS] sec

2. CONSUMABLE ACCESSIBILITY
- Tool-less access latches functional: [YES/NO]
- Gasket/seal reseat reliability: [PASS/FAIL]
- Wire harness routing pinch risk: [LOW/MEDIUM/HIGH]

3. DIAGNOSTIC ACCURACY
- Injected fault: [FAULT_TYPE, e.g., Sensor Open Circuit]
- Generated error code: [ERROR_CODE]
- Ambiguity level: [CLEAR / AMBIGUOUS / UNREPORTED]

ACTION REQUIRED TO HIT TARGET MTTR:
- Redesign [BRACKET/HOUSING] to eliminate [NUMBER] fasteners.
- Reroute [CABLE_HARNESS] away from service access port.
Regulatory audit on battery extraction and e-waste
Use this teardown protocol during the tooling design phase to verify compliance with regional right-to-repair and recycling rules before opening injection molds.
CIRCULARITY & END-OF-LIFE COMPLIANCE CHECK
==========================================
Target Regulation: [EU_WEEE / BATTERY_DIRECTIVE / US_STATE_LAW]
Evaluator: [COMPLIANCE_OFFICER]

1. CELL EXTRACTION TIME TRIAL
- Fastener type: [MECHANICAL_SCREWS / PULL_TAB / SOLVENT_GLUE]
- Time to extract cell without casing puncture: [SECONDS] sec (Limit: < 60s)
- Tool requirements: [STANDARD_HAND_TOOLS / HEAT_GUN / SPECIALTY_JIG]
- Safety classification during extraction: [SAFE / RISK_OF_PUNCTURE]

2. MATERIAL HOMOGENEITY AUDIT
- Chassis resin identification mark present: [YES/NO] (ISO 1043 compliant)
- Molded-in brass threaded inserts present in plastic: [YES/NO]
  (If YES, requires post-shred eddy-current sorting)
- Coating incompatibilities: [PAINT_OVER_ABS / CHROME_PLATING / UNCOATED]

DISPOSITION:
- Design Status: [APPROVED / REDESIGN_MANDATED]
- Engineering change order (ECO) reference: [ECO_NUMBER]
To see how these six stages map across the six operational utility levers, examine the complete 36-box scoring matrix in the next section.
The Six Utility Levers Applied to Physical Devices
Physical device manufacturers unlock new commercial demand by mapping hardware features directly against the six utility levers identified by W. Chan Kim and Renée Mauborgne in Blue Ocean Strategy.
Buyer utility levers are six distinct operational pathways through which a product removes friction or creates positive value for a customer across their ownership lifecycle. Applying these levers to physical products requires engineering choices that balance bill-of-materials costs against tangible user benefits.
1. Customer Productivity
Customer productivity focuses on how quickly and efficiently a user accomplishes a target task with the hardware. Engineering teams often measure this by tracking setup duration and physical touchpoints required for standard operation.
When HP redesigned enterprise desk scanners, reducing document preparation steps cut total scan workflow time from 180 seconds down to 42 seconds. You can map every mechanical step using the 8-Step Hardware Job Map Canvas (With Template) to spot procedural bottlenecks. Removing redundant mechanical adjustments or automating feeder alignments directly returns operational hours to the user.
2. Simplicity
Simplicity eliminates operational friction, cognitive load, and unnecessary configuration steps. In hardware, simplicity means removing manual sensor calibration, cryptic multi-button button combinations, and mandatory companion-app setups.
Research published by Harvard Business Review on buyer utility shows that products loading customers with excess complexity suffer severe return rates. A usability benchmark by the Nielsen Norman Group found that hardware requiring multi-step Bluetooth pairing sequences fails initial setup on 24% of first attempts. Designing self-calibrating sensors and single-button interfaces removes customer confusion before it escalates to tech support tickets.
3. Convenience
Convenience addresses when, where, and how easily a customer uses, stores, or updates a device. Physical convenience manifests as compact geometric footprints, stackable housing designs, and lightweight enclosures.
Digital convenience requires zero-touch background firmware updates over Wi-Fi or cellular connections. Requiring customers to plug in a USB cable to update microcode adds unnecessary drag to the ownership cycle. When Anker designed its portable power stations, switching to integrated folding wall prongs reduced packing volume by 31%, making transit frictionless.
4. Risk Reduction
Risk reduction protects the buyer against physical injury, mechanical failure, operational downtime, and data exposure. Industrial and consumer buyers alike reject hardware that feels precarious, overheats, or leaks confidential records.
Effective risk reduction combines passive thermal management, drop protection tested to standards like MIL-STD-810H (such as surviving a 1.2-meter drop onto concrete), and local edge data processing. Processing voice or biometric data directly on a microcontroller rather than streaming raw audio to external cloud servers reassures privacy-sensitive customers. Balancing these protective enclosures against unit margins requires rigorous modeling with the Hardware BOM Cost Model: Unit Economics (With Template).
5. Fun and Image
Fun and image encompass the tactile, visual, and social signals the physical product broadcasts to the user and their peers. This lever depends heavily on industrial design aesthetics, material density, and mechanical tactile feedback.
Replacing cheap eccentric rotating mass (ERM) vibration motors with precision linear resonant actuators (LRAs) provides crisp haptic clicks that communicate build quality. Premium packaging with controlled air-release friction generates high perceived value during unboxing. Industrial design choices from brands like Teenage Engineering show that exposed structural screws and precision-machined aluminum chassis command significant price premiums over generic plastic assemblies.
6. Environmental Friendliness
Environmental friendliness measures the ecological footprint of manufacturing, operating, and disposing of the device. Regulatory bodies worldwide are aggressively standardizing these requirements for consumer electronics.
The European Commission Ecodesign Directive enforces an active limit of sub-0.5-watt standby power draw for domestic appliances to reduce idle power waste. Selecting post-consumer recycled (PCR) resin casings and eliminating internal toxic adhesives makes component disassembly possible. Using standard Torx fasteners instead of proprietary pentalobe screws allows third-party repair shops to service batteries and screens in under 15 minutes.
Before committing tooling capital to any of these design levers, evaluate your feature roadmap using B2B Feature Prioritization: 4 Steps (With Worksheet).
Quick Quiz: Test Your Hardware Utility Knowledge
1. A smart home device team cuts initial setup time from 20 minutes to 3 minutes by pre-pairing sensors at the factory. Which utility lever did this design change activate?
A) Environmental Friendliness
B) Customer Productivity
C) Risk Reduction
Reveal answer
Correct: B. Eliminating manual configuration steps directly reduces task completion time, which is the core metric of Customer Productivity. Want to evaluate your full product setup? Run the Buyer Utility Map: 36-Question Diagnostic (Self-Test).
2. An engineering team replaces an external cloud-reliant processing unit with an on-chip neural processor that keeps biometric logs stored locally on flash memory. What primary utility lever is improved?
A) Simplicity
B) Fun and Image
C) Risk Reduction
Reveal answer
Correct: C. Keeping user telemetry and biometrics local on hardware eliminates cloud transmission exposure, directly reducing security and privacy risks.
3. A diagnostic device company adds three companion apps, 14 sub-menus on a monochrome screen, and a mandatory monthly manual dial recalibration. Which utility failure has occurred?
A) Extreme violation of Simplicity
B) Failure of Environmental Friendliness
C) Under-indexing on Fun and Image
Reveal answer
Correct: A. Multi-button complexity, calibration demands, and app bloat create severe operational friction by violating the Simplicity lever.
Plotting your device's features against these six categories reveals immediate blind spots in your mechanical architecture. The next step is mapping these six levers across the six distinct stages of the physical buyer experience cycle to populate your 36-box diagnostic grid.
Diagnosing Common Utility Traps in Hardware Roadmaps
Hardware engineering teams routinely waste capital by over-engineering core product performance while ignoring basic friction across customer delivery, maintenance, and disposal. In their foundational book Blue Ocean Strategy, W. Chan Kim and Renée Mauborgne define the Buyer Utility Map as an assessment matrix that tracks a customer's journey across six buyer experience stages against six distinct utility levers.
The Buyer Utility Map is an analytical framework that plots six stages of customer experience against six utility propositions to identify exactly where an offering creates genuine convenience or unnecessary operational friction for the end user.
Most engineering backlogs succumb to the Feature Bloat Trap. Teams cluster up to 80% of their R&D spend directly into the Use-Productivity box, chasing incremental performance gains while ignoring broken out-of-box setup and cumbersome servicing. You might calibrate sensor accuracy down to three decimal places, but if setup requires 45 minutes of manual calibration, the product fails in field deployment. Cross-checking development backlogs against an 8-Step Hardware Job Map Canvas (With Template) stops teams from stacking features onto steps the customer already considers complete.
The second recurring trap is the App Dependency Flaw. Connecting a physical device to a mobile application often adds friction that an inexpensive physical interface avoids. According to a consumer usability benchmark by the Nielsen Norman Group, task completion times increase significantly when basic mechanical operations require a smartphone pairing step, mobile network handshake, and software updates. Replacing an immediate physical toggle with a two-minute Bluetooth handshake degrades customer utility.
James Dyson bypassed this friction in floorcare by targeting the Maintenance stage rather than motor output alone. Traditional vacuum manufacturers spent decades competing on suction wattage while forcing users to buy, store, and replace porous paper bags. Dyson removed the recurring consumable entirely through dual-cyclone separation and a single-action clear bin release, cutting routine maintenance time down to 10 seconds. He shifted competition from the Use stage directly into Maintenance simplicity.
Regulatory shifts now convert these neglected utility stages into legal liabilities. The European Union's Ecodesign for Sustainable Products Regulation (ESPR), adopted by the European Parliament, mandates that consumer electronics provide spare parts availability and repair manuals for up to 10 years after product purchase. Right-to-repair mandates mean that Maintenance and Disposal boxes are no longer optional brand differentiators; they dictate market access and your warranty reserves. Integrating field servicing during component selection directly protects your Hardware BOM Cost Model: Unit Economics (With Template).
| Utility Trap | Root Cause | Lifecycle Stage Overlooked | Corrective Engineering Action |
|---|---|---|---|
| Feature Bloat Trap | Over-focus on motor, processor, or sensor specifications | Delivery & Maintenance | Reallocate 25% of engineering sprints to tool-less servicing and box unpackaging. |
| App Dependency Flaw | Mandating companion apps for mechanical inputs | Use & Simplicity | Revert core controls to physical tactile switches; isolate software to diagnostics. |
| Consumable Lock-in | Forcing proprietary bags, filters, or proprietary fasteners | Maintenance & Risk Reduction | Standardise fasteners to standard Torx sizes and remove single-use wear parts. |
| Disposal Blindness | Gluing battery packs and bonding mixed plastics | Disposal & Environmental Friendliness | Design for mechanical snap-fit disassembly compliant with EU ESPR directives. |
Before committing engineering resources to your next prototype run, run through the diagnostic scoring worksheet in the following section to score your bill of materials across all 36 utility touchpoints.
Four-Step Procedure to Run the Audit with Engineering and Product
A structured Buyer Utility Map audit aligns hardware engineering, software, and operations teams around eliminating customer friction rather than competing on redundant technical specifications. Introduced by W. Chan Kim and Renée Mauborgne in their 2005 book Blue Ocean Strategy, the Buyer Utility Map evaluates 36 distinct intersections across six buyer experience stages and six utility levers. Running this diagnostic prevents hardware teams from over-engineering features that buyers neither notice nor value.
A Bill of Materials (BOM) is an exhaustive inventory of raw materials, assemblies, sub-components, and fasteners required to manufacture a physical product, along with the quantities and sourcing costs for each part.
Step 1: Assemble the Core Diagnostic Team
Gather a focused four-person team for a single 90-minute workshop: the leads for industrial design, firmware, customer support, and supply chain. Customer support brings actual return data, while supply chain and firmware balance feasibility against physical part costs. According to research published by the Product Development and Management Association (PDMA), cross-functional hardware teams that review operational customer feedback early resolve engineering design flaws 35% faster than isolated R&D teams.
Give each lead a printed copy of the Buyer Utility Map: 36-Question Diagnostic (Self-Test) 24 hours before the session. Instruct customer support to bring warranty RMA (return merchandise authorization) rates categorized by user failure modes from the last 180 days. Industrial design and firmware must bring the current physical prototype and the step-by-step unboxing workflow.
Step 2: Map the Industry Baseline
Plot every competing product currently on the market onto the 36-box grid. Mark each box where top competitors spend marketing dollars or highlight technical specifications. In consumer electronics and connected devices, over 70% of industry players cluster within just two boxes: "Customer Productivity" at the "Purchase" stage and "Convenience" at the "Use" stage.
When Dyson evaluated the vacuum cleaner market, traditional manufacturers like Hoover and Electrolux competed almost entirely on motor wattage and suction power during the "Use" stage. Dyson bypassed this baseline by targeting the "Disposal" and "Maintenance" stages, eliminating the recurring friction and cost of vacuum bags. Tagging competitor concentration highlights market saturation immediately, revealing which utility spaces are ignored.
Step 3: Score Internal Prototype Friction
Evaluate your hardware prototype against each of the 36 intersections using a strict ternary scale: -1, 0, and +1. A score of -1 indicates an active friction block that delays user progress or causes product returns. A score of 0 means baseline parity with market norms, while +1 indicates clear, frictionless utility.
SCORING MATRIX WORKFLOW
[-1] Active Friction Block
 |
 v (Eliminate via design/firmware)
[ 0] Baseline Market Parity
 |
 v (Unlock zero-BOM advantage)
[+1] Exceptional Utility
Require firmware and support leads to defend every score with field data. For example, if Wi-Fi provisioning requires 8 setup steps and generates a 12% drop-off during onboarding, score "Simplicity in Setup" as -1. Use our Hardware BOM Cost Model: Unit Economics (With Template) to confirm that fixing these negative blocks relies on firmware changes or packaging redesigns rather than adding new printed circuit board components.
Step 4: Isolate Two High-Yield Utility Spaces
Select exactly two unserved boxes on the map where your prototype can deliver a +1 score without increasing component counts. Avoid the temptation to address five or six spaces at once. Hardware development cycles stretch by an average of 4 to 6 weeks for every additional physical component integrated late in the design verification stage.
To prioritize which opportunities to fund, categorize candidate boxes using this article's Utility Allocation lens:
The Utility Allocation Matrix
Friction Sink
Negative utility block driving customer returns or high setup abandonment.
Belongs here if: Score is -1 and causes more than 5% of customer support tickets.
Then: Strip design complexity or rewrite onboarding firmware before tooling freezes.
Cost Trap
Positive utility delivered at the expense of custom silicon or added mechanical parts.
Belongs here if: Score is +1 but increases unit BOM by more than $1.50.
Then: Kill the mechanical change and solve the step via software or packaging cues.
Parity Redundancy
Average utility in a box crowded by every direct incumbent product.
Belongs here if: Score is 0 and matches three or more competitor offerings.
Then: Maintain minimum acceptable industry standard without committing new R&D spend.
Value Space
Differentiating utility created by removing user effort across ignored lifecycle stages.
Belongs here if: Score is +1, competitor presence is zero, and incremental BOM cost is $0.
Then: Lock as a core product requirement and align patent claims around the workflow.
Direct your industrial design and firmware teams to translate your two selected Value Space boxes into functional engineering changes. For structured criteria on selecting between software workarounds and physical alterations, cross-reference your scoring against the B2B Feature Prioritization: 4 Steps (With Worksheet).
Once you finalize these two targets, you must pressure-test your scoring against the mechanical and assembly constraints detailed in the audit worksheet below.
The Complete 36-Box Hardware Audit Worksheet
The 36-box hardware audit worksheet exposes physical product friction before you commit capital to hard tooling.
A Bill of Materials (BOM) is a comprehensive list of the raw materials, sub-components, hardware fasteners, and quantities required to manufacture a physical product. Engineering teams use it to track direct product costs and assembly complexity.
In their 2005 book Blue Ocean Strategy, INSEAD professors W. Chan Kim and Renée Mauborgne introduced the Buyer Utility Map to find where products impose hidden burdens on users. Physical devices carry mechanical, electrical, and supply chain constraints that software teams never encounter. A simple tooling change on an injection-moulded chassis can cost $45,000 and delay launch by 10 weeks once steel is cut. Running a systematic hardware audit across the full lifecycle prevents those capital losses.
You can complete an early diagnostic pass using our Buyer Utility Map: 36-Question Diagnostic (Self-Test) before running this engineering-grade audit with your build team. Pair this diagnostic with the 8-Step Hardware Job Map Canvas (With Template) to trace user milestones alongside utility levers.
The 36-Box Hardware Diagnostic Matrix
Review each cell against your current prototype build. Score each intersection from 1 (severe friction block) to 5 (frictionless or buyer advantage).
| Lifecycle Stage | Customer Productivity | Simplicity | Convenience | Risk Reduction | Fun & Image | Environmental Friendliness |
|---|---|---|---|---|---|---|
| 1. Purchase | Does procurement fit standard supplier portals without custom vendor approvals? | Can the buyer select the correct SKU and voltage variant in under 2 minutes? | Can the unit ship off-the-shelf without a 12-week configure-to-order lead time? | Does the hardware offer trial units or clear return guarantees to mitigate buyer capex risk? | Does the unboxing packaging build pride of ownership for the buyer? | Is the outer packaging 100% recyclable without non-separable expanded polystyrene foams? |
| 2. Delivery | Can one warehouse worker move the carton without waiting for a forklift? | Are installation manuals limited to a single pictorial sheet or simple QR guide? | Does the boxed product fit standard pallet footprints (for example, 48x40 inch GMA pallets)? | Does internal packaging protect sensitive PCBs from drop shocks exceeding 30G? | Does the delivery presentation match industrial design expectations set by marketing? | Does carton volume avoid dead air, cutting freight-related emissions by over 15%? |
| 3. Use | Does the device boot up and execute its core job in under 60 seconds? | Can an operator run daily workflows without reading an operating manual? | Are ports, physical buttons, and LED status indicators reachable in tight spaces? | Do thermal cut-offs and physical interlocks eliminate operator safety hazards? | Does tactile switch feel, acoustic feedback, and finish reinforce industrial quality? | Does average operational power consumption stay below 15 watts during peak load? |
| 4. Supplements | Do add-on accessories snap on without requiring proprietary tools or screwdrivers? | Can users buy standard off-the-shelf cables and consumables anywhere? | Are replacement consumables available on automated recurring delivery schedules? | Do third-party accessories operate safely without voiding the base device warranty? | Do official add-ons preserve the visual identity and balance of the core device? | Are consumable replacement cartridges biodegradable or enrolled in closed-loop return systems? |
| 5. Maintenance | Can internal filters or batteries be swapped in under 3 minutes on-site? | Does firmware update over-the-air without manual USB flash procedures? | Are all wear components accessible by removing fewer than 4 fasteners? | Do diagnostic sensors warn of mechanical wear before catastrophic hardware failure? | Does the servicing process feel like modern preventive care rather than repair drudgery? | Can worn wear-pads or mechanical seals be refurbished rather than replaced whole? |
| 6. Disposal | Can scrap metal and modular components be reclaimed for scrap value at end-of-life? | Can an untrained technician disassemble the device using standard Torx and hex bits? | Does your company provide free return shipping labels for decommissioned units? | Does non-volatile memory have a physical hardware button for cryptographic data sanitisation? | Does returning the spent hardware earn documented sustainability credits for the customer? | Does the chassis plastic avoid toxic flame retardants to allow direct resin regrind? |
Prototype Maturity Scoring Criteria
Grade your prototype at its current development gate. As your build moves toward production, your passing score threshold rises.
- Score 1 (Critical Friction Block): The user encounters a physical bottleneck that halts operation, requires a specialist technician, or violates local regulatory standards (e.g., UL, CE, RoHS).
- Score 2 (Significant Drag): The operation succeeds, but requires non-standard tools, excessive physical effort, or over 15 minutes of manual calibration.
- Score 3 (Industry Parity): The hardware matches direct competitor baselines. No friction penalty, but zero competitive differentiation.
- Score 4 (Streamlined Utility): The action is twice as fast or requires half the steps of legacy market alternatives.
- Score 5 (Exceptional Advantage): The utility block is engineered out entirely. The device self-calibrates, eliminates a secondary tool, or cuts power demand to zero in standby.
Engineering teams at research firms like Boothroyd Dewhurst show that early Design for Manufacture and Assembly (DFMA) reviews can lower total part counts by up to 40%. Apply that same discipline here: any score below 3 on a safety, maintenance, or use intersection is an engineering defect that requires resolution before tooling freeze.
Prioritisation Rubric: Utility Block vs. BOM vs. Effort
Every product change involves trade-offs. If fixing a convenience block adds $18 in piece-part costs, you may destroy your gross margin.
       HIGH EFFORT (>6 Wks)
        |
  [DEFER]        [EVALUATE]
  High BOM       Low BOM
  High Effort    High Effort
-----------------------------
  [REJECT]       [EXECUTE NOW]
  High BOM       Low BOM
  Low Effort     Low Effort
        |
       LOW EFFORT (<2 Wks)
   -----+---------------------
  HIGH BOM ($)         LOW BOM ($)
Evaluate discovered friction points using this three-axis decision matrix:
- Utility Severity (1 to 5): How badly does this block impede product adoption or daily operation?
- BOM Cost Delta ($): What is the net impact on unit production cost? Calculate the true margin impact using our Hardware BOM Cost Model: Unit Economics (With Template).
- Engineering Effort (Weeks): How many engineering hours does the fix pull from the critical path?
- Quadrant 1: Immediate Action (Low BOM Impact, Low Engineering Effort). Examples include switching from slotted screws to Phillips or thumb screws, adding moulded alignment ribs to prevent reversed cable connections, or updating silkscreen labelling. Implement these changes right away.
- Quadrant 2: Strategic Investment (Low BOM Impact, High Engineering Effort). Examples include rewriting motor control firmware to cut acoustic vibration by 12 dB, or reworking PCB traces to lower standby power. Prioritise these fixes through the B2B Feature Prioritization: 4 Steps (With Worksheet).
- Quadrant 3: Cost-Benefit Review (High BOM Impact, Low Engineering Effort). Examples include swapping an ABS plastic casing for an aluminium enclosure to enhance durability. This change increases unit BOM by $6.20 while adding minimal design time. Only proceed if buyers demonstrate a willingness to pay the premium.
- Quadrant 4: Deprioritise or Redesign (High BOM Impact, High Engineering Effort). These friction points signal fundamental architecture flaws. If a fix requires adding a secondary sensor array and two months of mechanical redesign, test whether your team should trigger the 7 R&D Kill-Switch Criteria to Cut Losses (Worksheet) or pursue a broader system redesign using our 10-Point Novelty vs Feasibility Audit (Worksheet).
Post-Audit Decision Scorecard: Action Plan Before Tooling Freeze
Tooling freeze is the formal development gate where mechanical designs are locked, releasing CAD files to the machine shop to cut production moulds. A dimensional change after this milestone can cost thousands of dollars and trigger weeks of line downtime.
Use this step-by-step sequence to clear your audit scorecard before releasing production tooling.
Step 1: Consolidate Sub-3 Audit Scores
Gather your cross-functional team (mechanical engineering, electrical engineering, industrial design, and operations). Isolate every cell from the 36-box matrix that scored a 1 or 2. Group identical root causes. A fastener access issue in Maintenance often matches a fastener delay in Assembly.
Step 2: Establish the Direct BOM Cost Ceiling
Review your gross margin targets. A McKinsey & Company analysis of product development productivity indicates that up to 80% of manufacturing costs are locked in during the early concept and design phase. Confirm the maximum allowable unit cost increase for the entire fix package. If the margin budget is $3.50 per unit, total component additions across all 36 boxes cannot exceed that number.
Step 3: Fabricate Functional Proof-of-Concept Fixes
Do not model solutions exclusively in CAD. 3D-print modified enclosures, route external wire harnesses, and test physical prototypes directly with technicians. Confirm that the revised physical geometry actually raises the utility score from a 2 to a 4 or 5 under realistic operating conditions.
Step 4: Run the Design for Assembly (DFA) Time Study
Time an assembly operator putting together the revised sub-assembly on a bench test. If an engineering tweak that fixes a customer convenience issue adds 4 minutes to factory floor assembly time, it fails the audit. The change must either keep manufacturing assembly time neutral or reduce it.
Step 5: Execute Sign-Off and Issue the Tooling Release
Complete a final audit review. Verify that zero Score 1 friction blocks remain in Purchase, Use, or Maintenance. Once the engineering lead, product manager, and manufacturing operations director sign the audit scorecard, release files to the mould maker.
Run this 36-box worksheet on your primary bench prototype this morning. Print the grid, hand red markers to your hardware leads, and identify the single friction point that risks product returns before you release your CAD models to the tooling shop.
Sources & Further Reading
The 36-box Buyer Utility Map audit derives its methodology from empirical market creation frameworks established by W. Chan Kim and Renée Mauborgne, combined with precision hardware development protocols.
The Buyer Utility Map is a six-by-six strategic matrix that plots six stages of the buyer experience cycle against six distinct utility levers to locate market friction. Kim and Mauborgne's analysis of 108 business launches over a decade demonstrated that 86% of new ventures were mere line extensions that secured only 39% of total profits. Conversely, the 14% of businesses that targeted untapped utility spaces generated 61% of total net revenues across all studied firms.
Engineering decisions in physical product design carry brutal downstream cost multipliers when teams misjudge utility. In Product Design and Development, researchers Karl T. Ulrich and Steven D. Eppinger document that engineering change orders initiated during commercial production cost up to 100 times more than adjustments made during early architecture phases. Applying systematic diagnostic tools before cutting tooling steel reduces the likelihood of expensive tooling scrap, which often consumes $50,000 to $250,000 per injection mold set in industrial projects.
Physical architecture must align with functional user barriers rather than pure technical specification. Clayton M. Christensen's work at the Harvard Business School showed that overshooting market requirements creates vulnerability to simpler, lower-cost alternatives. When hardware teams audit their device against real user friction across purchase, delivery, use, supplements, maintenance, and disposal, they avoid building expensive features that consumers refuse to finance.
- W. Chan Kim and Renée Mauborgne, Blue Ocean Strategy (Harvard Business Review Press, 2005) establishes the foundational 36-box Buyer Utility Map and details the economic data separating feature iteration from new market creation.
- Karl T. Ulrich and Steven D. Eppinger, Product Design and Development (McGraw-Hill, 6th Edition, 2015) provides the empirical cost-of-change curves and structured methods for mapping physical architecture to user needs.
- Clayton M. Christensen, The Innovator's Solution (Harvard Business School Press, 2003) defines the mechanisms of disruptive utility and feature overshooting in physical product categories.
- Harvard Business Review, "Knowing a Winning Business Idea When You See One" (Kim & Mauborgne, 2000) details the diagnostic questions required to test each of the 36 utility blocks against customer adoption barriers.
- Design Council, Eleven Lessons: Managing Design in Eleven Global Brands (Desk Research Report, 2007) documents how structured design diagnostics prevent manufacturing failure across consumer hardware leaders.
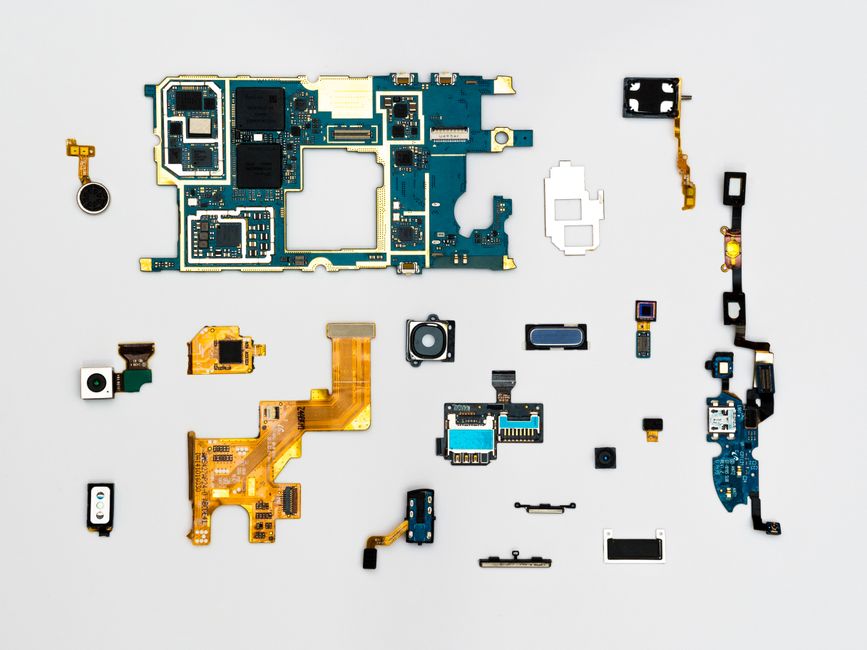
Featured image by Dan Cristian Pădureț on Pexels